Today morning, my one friend call me, saying there is a bug with SQL Server. As per his statement after renaming a Stored procedure name from SSMS, SP_HELPTEXT showing old name in script while SSMS is showing changed name, I think it’s not a system bug because its happens when the store procedure is renamed using right click and rename in GUI or using SP_rename <object name>, the sys.syscomments system table is not getting updated and SQL statement shown by sp_helptext is from sys.syscomments. by using ALTER statement sys.syscomments get updated. So, Renaming a stored procedure, function, view, or trigger will not change the name of the corresponding object name in the definition column of the sys.sql_modules catalog view. Therefore, it’s recommend that sp_rename/or from GUI, should not be used to rename these object types. We can use alter statement or drop and re-create the object with its new name.
SP_HELPTEXT showing old Store Procedure name after rename
Posted: March 14, 2014 by Virendra Yaduvanshi in Database AdministratorTags: sp_helptext bug, sp_helptext for SP, SP_helptext for Stored Procedure, SP_Helptext showing wrong object name, SP_Helptext showing wrong object name after renaming in SSMS
Performance Monitoring through Management Data Warehouse
Posted: March 14, 2014 by Virendra Yaduvanshi in Database AdministratorTags: Activating Management Data Warehouse, Central Management Data Warehouse, Data Collector in SSMS, initiating MDW, Management Data Warehouse, Management Data Warehouse for Performance Monitoring, MDW, MDW Drilldown Report, Performance Monitoring through Management Data Warehouse, Set up Data collector, SQL Server Central Management Data Warehouse, SQL server performance monitoring using MDW, SQL Servers monitoring
It’s a very common and sometime frustrating/irritating task for a DBA to trouble shoot SQL Server performance issues. With SQL server 2008 a very useful concept i.e. Management Data Warehouse – MDW introduced for continuous performance monitoring. MDW has an API that allows recording of performance counters from components outside of SQL Server parallel to the recording of built-in SQL Server and Operating System performance counters. MDW captures every standard performance counter traditionally used for performance analysis. MDW captures key Windows Performance Monitor (PerfMon) counters and internal SQL Server counters automatically into a SQL Server database. The collected data is being stored in SQL server Database. The following is the illustration of MDW.
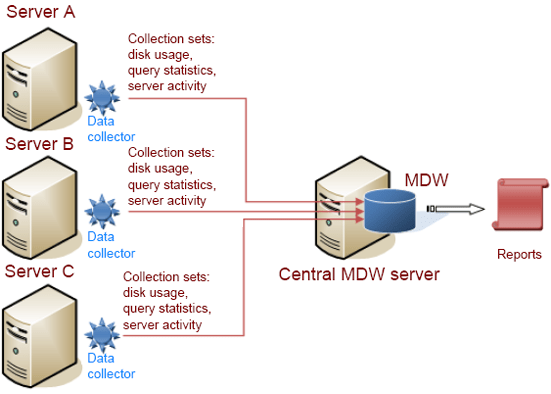
Server installation installs MDW automatically. Let’s activating MDW step-by-step in SQL server 2008.
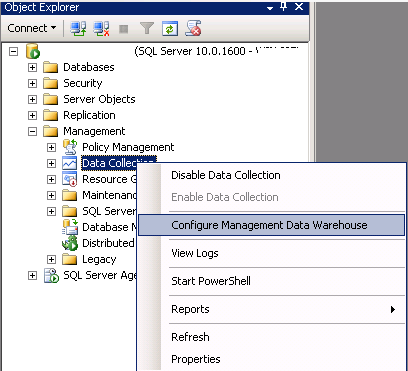
- In SQL Server Management Studio (SSMS), open Management, Data Collection and then right-click and select Configure Management Data Warehouse.
-
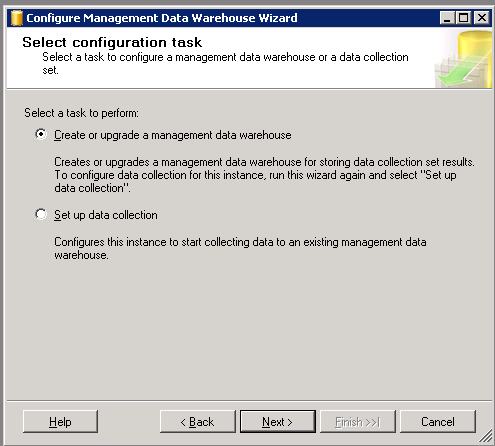
It will show a welcome screen, Select [Next], Now “Select configuration task” dialog will be appear, Select “Create or upgrade a management data warehouse” and then click [Next].
-
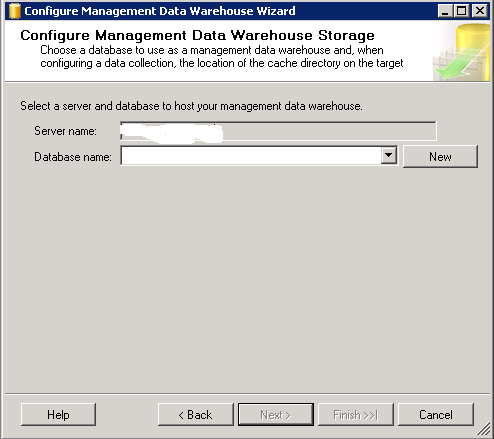
On the Configure Management Data Warehouse Storage screen, click [New].
-
When the [New Database] dialog box appears, enter DB Name and set your prefer location of this DB. Click [OK].
-
The [Configure Management Data Warehouse Storage] dialog will re-appear, click [Next].

-
The [Map Login and Users] dialog will appear. If you are an administrator, there is no need to add a mapping, otherwise add assign a login/user. Click [Next].
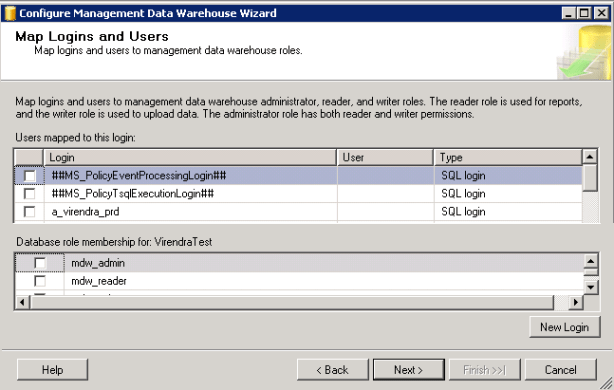
-
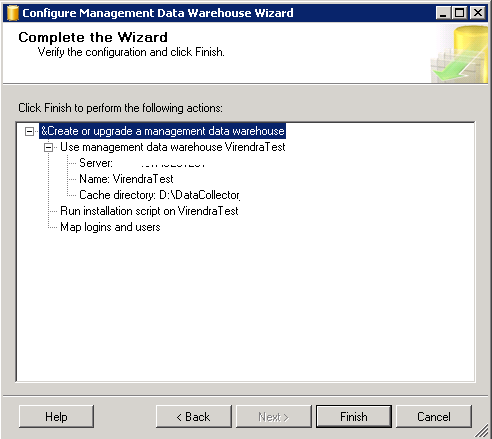
On the [Complete the Wizard] dialog, click [Finish].
-
Next, the [Configure Data Collection Wizard Progress] dialog. When it completes, click [Close].

-
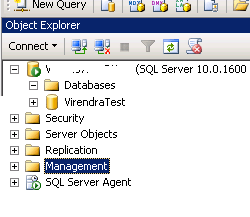
Now a new database (as per given name) has been created. In SSMS it will be shown.
-
Now we have created a MDW database, which will be used to store other server’s data for monitoring purpose, Let we have 3 server named as Server A, Server B and Server C as per above MDW illustration, we want to capture data from all these 3 servers, for same we have to follow these steps on each server from point 10 to 12.
Now connect Server A, in SSMS, go to Management, Data Collection and then right-click and “select Configure Management Data Warehouse menu” item. On welcome screen, select [Next], This time, however, “select Set up data collection” and click [Next].

-
Now on “Configure MDW Storage”, Select your server name and DB name that is the host for MDW.
-
Click on [Next], then click [Finish], then Close.
The same thing should be repeated on all servers which needs to be monitor.
Note: Its observation, if all servers are in a domain, there should be an AD account to start SQL agent services on each server which are being monitored.
Go to your MDW database , right click on it, Select “Reports”, then “Management Data Warehouse” then “Management Data Warehouse overview”, all servers will be displayed and now we will able to monitor server’s “Server Activity”, “Query Statistics” and “Disk Usage” will drill down reporting facilities.
Recovering queries if SSMS crashed
Posted: January 27, 2014 by Virendra Yaduvanshi in Database AdministratorTags: Query backup, query temp location, Recover query files in SQL Server Management Studio, Recover query files in SQL Server Management Studio when crashed, SSMS crashed
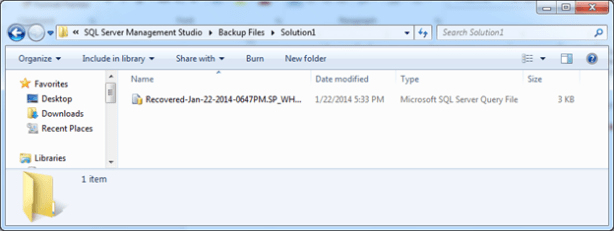
It sometimes happened (hope all of us experienced this one) that during working with SQL Server Management Studio (SSMS) it got crashed for whatever reason. For same there is a chance that we will lose whatever queries we had open at the time of the crash. Sometimes when we re-open SSMS it will ask us to re-open any files that we recover but for some reason it doesn’t always do that and in that instance we think that our work has gone for good.
Here is a way to get some information, even if SSMS does not prompt us to recover those files they are probably still present on your machine. Go and check in your C:\Users\Virendra\Documents\SQL Server Management Studio\Backup Files\Solution1 folder.
Please share your good/bad experiences …
Database’s Restore Details
Posted: December 31, 2013 by Virendra Yaduvanshi in Database AdministratorTags: Database restore information, Database’s Restore Details, how to know restore details, Identify when a SQL Server database was restored from which source and backup set, Knowing when a SQL Server database was restored, restored database's backup information, SQL Server restore details, when backup restored
It’s a very common practice every DBA verifies where restored Database is as per expected or not, and there may be a question where restored database is restored from proper backup or not. Here is a query which will show how we can identify the file(s) that was used for the restore, when the backup actually occurred and when the database was restored.
SELECT RH.[destination_database_name] Destination_DB_Name, RH.[restore_date] Restore_Date, BKS.[backup_start_date] Backup_StartDateTime, BKS.[backup_finish_date] Backup_FinishDateTime,
BKS.[database_name] as [Source_Database_Name], BMF.physical_device_name] as [Backup_file_used_for_Restore],
RF.file_number File_number,RF.destination_phys_drive Restore_TragetDrive,
RF.destination_phys_name Restore_TragetFileName
FROM msdb..restorehistory RH
INNER JOIN msdb..restorefile RF on RH.restore_history_id = RF.restore_history_id
INNER JOIN msdb..backupset BKS ON RH.[backup_set_id] = BKS.[backup_set_id]
INNER JOIN msdb..backupmediafamily BMF ON BKS.[media_set_id] = BMF.[media_set_id]
ORDER BY RH.[restore_date] DESC
Please comment if any suggestion or modification J
The WordPress.com stats helper monkeys prepared a 2013 annual report for this blog.

Here’s an excerpt:
The concert hall at the Sydney Opera House holds 2,700 people. This blog was viewed about 12,000 times in 2013. If it were a concert at Sydney Opera House, it would take about 4 sold-out performances for that many people to see it.
All Database Backup – SQL Express
Posted: December 30, 2013 by Virendra Yaduvanshi in Database AdministratorTags: All Database Backup, All Database Backup – SQL Express, Backup in SQL Express, Backup in SQL Server Express, Database Backup, Express edition Database Backup, How to take all database backup, script to take all Database backup, SQL Server Backup, SQL Server Express - All Database Backup
A user who is using SQL Server express edition, came to me and ask how to take All Database Backup at a time. Here is a simple script to take all database backup at a specified location.
DECLARE @name VARCHAR(50) — database name
DECLARE @path VARCHAR(256) ––– path for backup files
DECLARE @fileName VARCHAR(256) –– filename for backup
DECLARE @fileDate VARCHAR(20) –– used for file name
SET @path = ‘D:\DBBACKUP\’
SELECT @fileDate = CONVERT(VARCHAR(20),GETDATE(),112)
DECLARE db_cursor CURSOR FOR
SELECT name FROM master.dbo.sysdatabases WHERE name NOT IN (‘master’,‘model’,‘msdb’,‘tempdb’)
OPEN db_cursor
FETCH NEXT FROM db_cursor INTO @name
WHILE @@FETCH_STATUS = 0
BEGIN
SET @fileName = @path + @name + ‘_’ + @fileDate + ‘.BAK’
BACKUP DATABASE @name TO DISK = @fileName
FETCH NEXT FROM db_cursor INTO @name
END
CLOSE db_cursor
DEALLOCATE db_cursor
Find Objects dependencies details
Posted: December 30, 2013 by Virendra Yaduvanshi in Database AdministratorTags: dependencies in a Database, dependent objects in a database, Find Objects dependencies details, know dependent objects, SQL Server objects dependencies
Here is a script to find objects dependencies details in a Database.
SELECT SCH.name + ‘.’ + OBJ.name AS ObjectName ,OBJ.type_desc AS ObjectType ,COL.name AS ColumnName,DEP.referenced_database_name AS ReferencedDatabase ,REFSCH.name + ‘.’ + REFOBJ.name AS ReferencedObjectName ,REFOBJ.type_desc AS ReferencedObjectType ,REFCOL.name AS ReferencedColumnName ,DEP.referencing_class_desc AS ReferenceClass ,DEP.is_schema_bound_reference AS IsSchemaBound
FROM sys.sql_expression_dependencies AS DEP
INNER JOIN sys.objects AS OBJ ON DEP.referencing_id = OBJ.object_id
INNER JOIN sys.schemas AS SCH ON OBJ.schema_id = SCH.schema_id
LEFT JOIN sys.columns AS COL ON DEP.referencing_id = COL.object_id AND DEP.referencing_minor_id = COL.column_id
INNER JOIN sys.objects AS REFOBJ ON DEP.referenced_id = REFOBJ.object_id
INNER JOIN sys.schemas AS REFSCH ON REFOBJ.schema_id = REFSCH.schema_id
LEFT JOIN sys.columns AS REFCOL ON DEP.referenced_class IN(0, 1)AND DEP.referenced_minor_id = REFCOL.column_id AND DEP.referenced_id = REFCOL.object_id
ORDER BY ObjectName,ReferencedObjectName ,REFCOL.column_id
Finding User who ran DROP/DELETE/UPDATE/INSERT on SQL Server
Posted: December 30, 2013 by Virendra Yaduvanshi in Database AdministratorTags: find deleted record timing, find inserted record timing, find updated record timing, Finding User who ran DELETE, Finding User who ran DROP, Finding User who ran INSERT on SQL Server, Finding User who ran UPADTE, finding usern who did mistake, fn_dblog, fn_dblog operations details, knowing user activities, SQL server DML actions track, when incident happend, who did what, who is culprit on SQL server, who ran DELETE, who ran drop table, who ran Insert, WHO ran Update
Its commonly happened at all work place where a user trigger a DROP or DELETE command by mistake or intensely on a SQL Server and no one will be accepting who did this. Here, I would like to demonstrate a way using the transaction log to track down helpful information related to this incident.
As a standard, to find such users is with the help of the default trace, because the default trace captures and tracks database activity performed on SQL Server instance, but if your system is very busy in that case the trace files may roll over far too fast and it may not be able to catch some of the changes in database. But these changes are also tracked in the transaction log file of the database and we will use this to find the users in questions.
To achieve this, we can use undocumented function fn_dblog
to find any unauthorized or unapproved deletes or table drops. The below tip will help to track or find any unethical or an unwanted user who has dropped a table or deleted data from a table. Its strongly suggested, Please don’t test this tips on production environment, test first it with test/Dev lab environment.
Here, I have created a Database Named ‘VIRENDRATEST’ and a create a Table Named ‘tblTest’ as
–Creating DB VirendraTest
USE [master]
GO
CREATE DATABASE VirendraTest;
GO
— Creating Table tblTest
USE VirendraTest;
GO
CREATE TABLE tblTest ( ID INT IDENTITY, Ord_Date DATETIME DEFAULT GETDATE ())
— Inserting dummy test Data
INSERT INTO tblTest DEFAULT VALUES
GO 100
Now, suppose, you have deleted record having ID=10 as
Delete tblTest where ID =10
Now here, find the user who deleted row/rows , steps are as below
-
Find transaction ID from :SELECT [Transaction ID],Operation, Context,AllocUnitName FROM fn_dblog(NULL, NULL)
WHERE Operation = ‘LOP_DELETE_ROWS’
-
Now We have found the transaction ID from the above command which we will use in the below command to get the transaction SID of the user who has deleted the data from below command,
SELECT Operation,[Transaction ID], [Begin Time], [Transaction Name], [Transaction SID]
FROM fn_dblog(NULL, NULL) WHERE [Transaction ID] = ‘0000:00000752’
AND [Operation] = ‘LOP_BEGIN_XACT’

-
Using Transaction ID , we can get exact user name as
Select SUSER_SNAME(0x01050000000000051500000060A4EEB0789A03300FF709CFE8030000)
Above syntax will show exact user name.

Below is the list from where we can find out operations timing with these types of details (It’s not a complete list, I just get it from self-practice and some Google)
| Sr. No. | OPERATION | DESCRIPTION |
| 1 | LOP_ABORT_XACT | Indicates that a transaction was aborted and rolled back. |
| 2 | LOP_BEGIN_CKPT | A checkpoint has begun. |
| 3 | LOP_BEGIN_XACT | Indicates the start of a transaction. |
| 4 | LOP_BUF_WRITE | Writing to Buffer. |
| 5 | LOP_COMMIT_XACT | Indicates that a transaction has committed. |
| 6 | LOP_COUNT_DELTA | |
| 7 | LOP_CREATE_ALLOCCHAIN | New Allocation chain |
| 8 | LOP_CREATE_INDEX | Creating an index. |
| 9 | LOP_DELETE_ROWS | Rows were deleted from a table. |
| 10 | LOP_DELETE_SPLIT | A page split has occurred. Rows have moved physically. |
| 11 | LOP_DELTA_SYSIND | SYSINDEXES table has been modified. |
| 12 | LOP_DROP_INDEX | Dropping an index. |
| 13 | LOP_END_CKPT | Checkpoint has finished. |
| 14 | LOP_EXPUNGE_ROWS | Row physically expunged from a page, now free for new rows. |
| 15 | LOP_FILE_HDR_MODIF | SQL Server has grown a database file. |
| 16 | LOP_FORGET_XACT | Shows that a 2-phase commit transaction was rolled back. |
| 17 | LOP_FORMAT_PAGE | Write a header of a newly allocated database page. |
| 18 | LOP_HOBT_DDL | |
| 19 | LOP_HOBT_DELTA | |
| 20 | LOP_IDENT_NEWVAL | Identity’s New reseed values |
| 21 | LOP_INSERT_ROWS | Insert a row into a user or system table. |
| 22 | LOP_LOCK_XACT | |
| 23 | LOP_MARK_DDL | Data Definition Language change – table schema was modified. |
| 24 | LOP_MARK_SAVEPOINT | Designate that an application has issued a ‘SAVE TRANSACTION’ command. |
| 25 | LOP_MIGRATE_LOCKS | |
| 26 | LOP_MODIFY_COLUMNS | Designates that a row was modified as the result of an Update command. |
| 27 | LOP_MODIFY_HEADER | A new data page created and has initialized the header of that page. |
| 28 | LOP_MODIFY_ROW | Row modification as a result of an Update command. |
| 29 | LOP_PREP_XACT | Transaction is in a 2-phase commit protocol. |
| 30 | LOP_SET_BITS | |
| 31 | LOP_SET_BITS | Designates that the DBMS modified space allocation bits as the result of allocating a new extent. |
| 32 | LOP_SET_FREE_SPACE | Designates that a previously allocated extent has been returned to the free pool. |
| 33 | LOP_SORT_BEGIN | A sort begins with index creation. – SORT_END end of the sorting while creating an index. |
| 34 | LOP_SORT_EXTENT | Sorting extents as part of building an index. |
| 35 | LOP_UNDO_DELETE_SPLIT | The page split process has been dumped. |
| 36 | LOP_XACT_CKPT | During the Checkpoint, open transactions were detected. |
Please let me know about description’s missing values in above table. 🙂
SQL Server’s the UNSEEN bottleneck
Posted: December 18, 2013 by Virendra Yaduvanshi in Database AdministratorTags: code bottleneck, fine tuning, optimization tips, performance issue, Query - Best Practices, query optimization, SP code optimization, SQL server performance issue, SQL Server’s the UNSEEN bottleneck, Stored procedure code optimization
Sometimes it happened with a developer or even with a DBA, a query seems to be a very perfect over time and time, having appropriate index, but taking long time to show result. As per my understanding in multiple scenario there may be various reasons. But one very common and widely happened error is data type conversion issue. As we know Data types can be converted either implicitly or explicitly. Implicit conversions are not visible to the user. SQL Server automatically converts the data from one data type to another while Explicit conversions use the CAST or CONVERT functions. The CAST and CONVERT functions convert a value (a local variable, a column, or another expression) from one data type to another.
Here, I am pointing about Implicit conversions, it’s a silent killer and it has been seen this literally bring a system to its knees by causing deadlocks during high load, CPU at maximum utilization, performance issues and people started blaming on server, but reason is something different. Let see below example,
Create Procedure usp_VirendraTest @ID VarChar(10)
As
Select ID,Name,Fname,BloodGroup,Dept,Desig From tblVirendraTest Where ID = @ID
The code looks very adequate and works good at initial stage but it starts show their own color when table’s rows count become multi millions. The reason is ID column belongs to INT data type and Developers and even DBAs get confused and write a procedure with the wrong data type in this scenario. Now problem started, every time SQL Server has to look for a ID values and it has to convert @ID from a VarChar to an Int. This is an implicit conversion of data type. Internally, SQL Server uses a convert function perform this operation. When this happens, SQL Server cannot use an index effectively. it has to convert the value for each and every row and as a resultant SQL Server scans the entire table for the value. This takes time and, under default locking modes, places a share lock on the entire table preventing other processes from updating/Inserting/Deleting records while the scan is taking place.
The solution for this type of problem is use of CAST or CONVERT.
Here is the Data type conversions chart from Microsoft

Thanks for happy reading, Please comment and suggest the better ways. JJ
Find Most Executed Stored Procedures
Posted: December 3, 2013 by Virendra Yaduvanshi in Database AdministratorTags: Count of executed Procedures, Find Most Executed Stored Procedures, sys.dm_exec_cached_plans, sys.dm_exec_sql_text, System optimization tips
An important step in optimizing a system is to take a universal approach and look at stored procedures that are called very often. These procedures can often be the backbone of a system. Sometimes optimizing these procedures can have a dramatic effect on relieving the physical bottlenecks of the system and improving end-user experience.
The following DMV query shows the execution count of each stored procedure, sorted by the most executed procedures first.
SELECT DatabaseName = DB_NAME(st.dbid),
SchemaName = OBJECT_SCHEMA_NAME(st.objectid,dbid),
StoredProcedure = OBJECT_NAME(st.objectid,dbid),
ExecutionCount = MAX(cp.usecounts)
FROM sys.dm_exec_cached_plans cp
CROSS APPLY sys.dm_exec_sql_text(cp.plan_handle) ST
WHERE DB_NAME(st.dbid) IS NOT NULL AND cp.objtype = ‘PROC’
GROUP BY cp.plan_handle,DB_NAME(st.dbid),OBJECT_SCHEMA_NAME(objectid,st.dbid),OBJECT_NAME(objectid,st.dbid),st.text
ORDER BY MAX(cp.usecounts) DESC
These execution counts are an aggregate from the last time SQL Server has been restarted.
